Market Context
Track candles, relative movement, volume, and market structure across a focused crypto universe.
Investor demo live
AI prediction signals, strategy simulation, market context, and portfolio analytics in one workflow built for faster crypto decision-making.
FinBright connects the pieces that usually live in separate notebooks, dashboards, and scripts: market data, model signals, strategy rules, and portfolio-level risk.
Track candles, relative movement, volume, and market structure across a focused crypto universe.
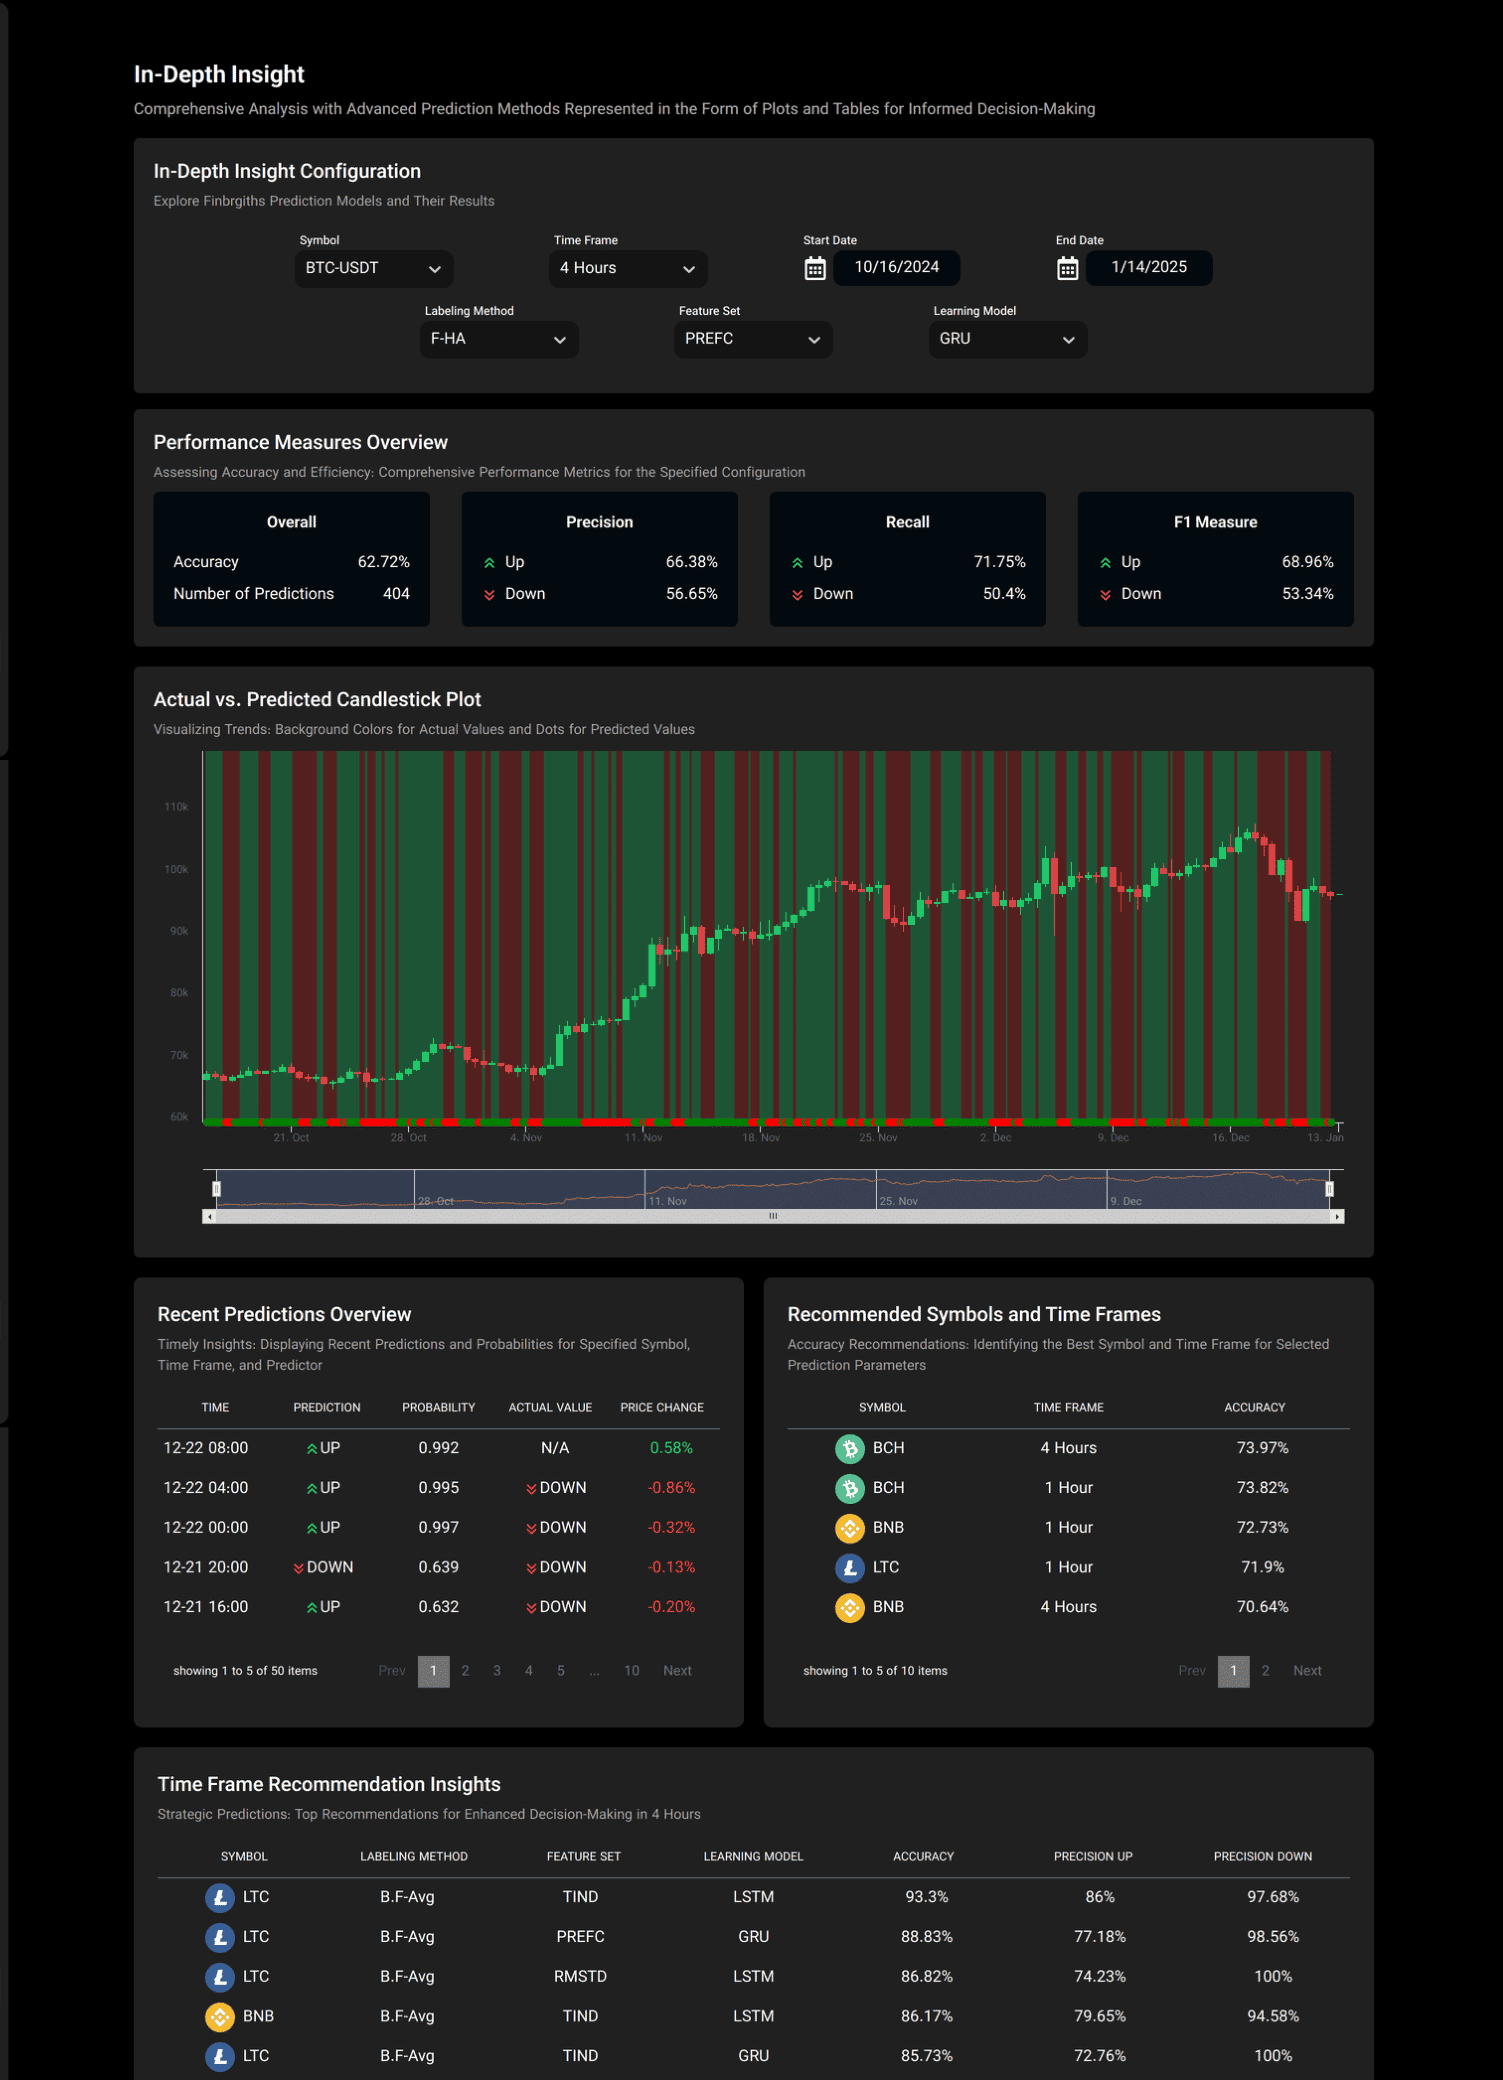
Compare labeling methods, feature sets, and deep learning models through a consistent prediction interface.
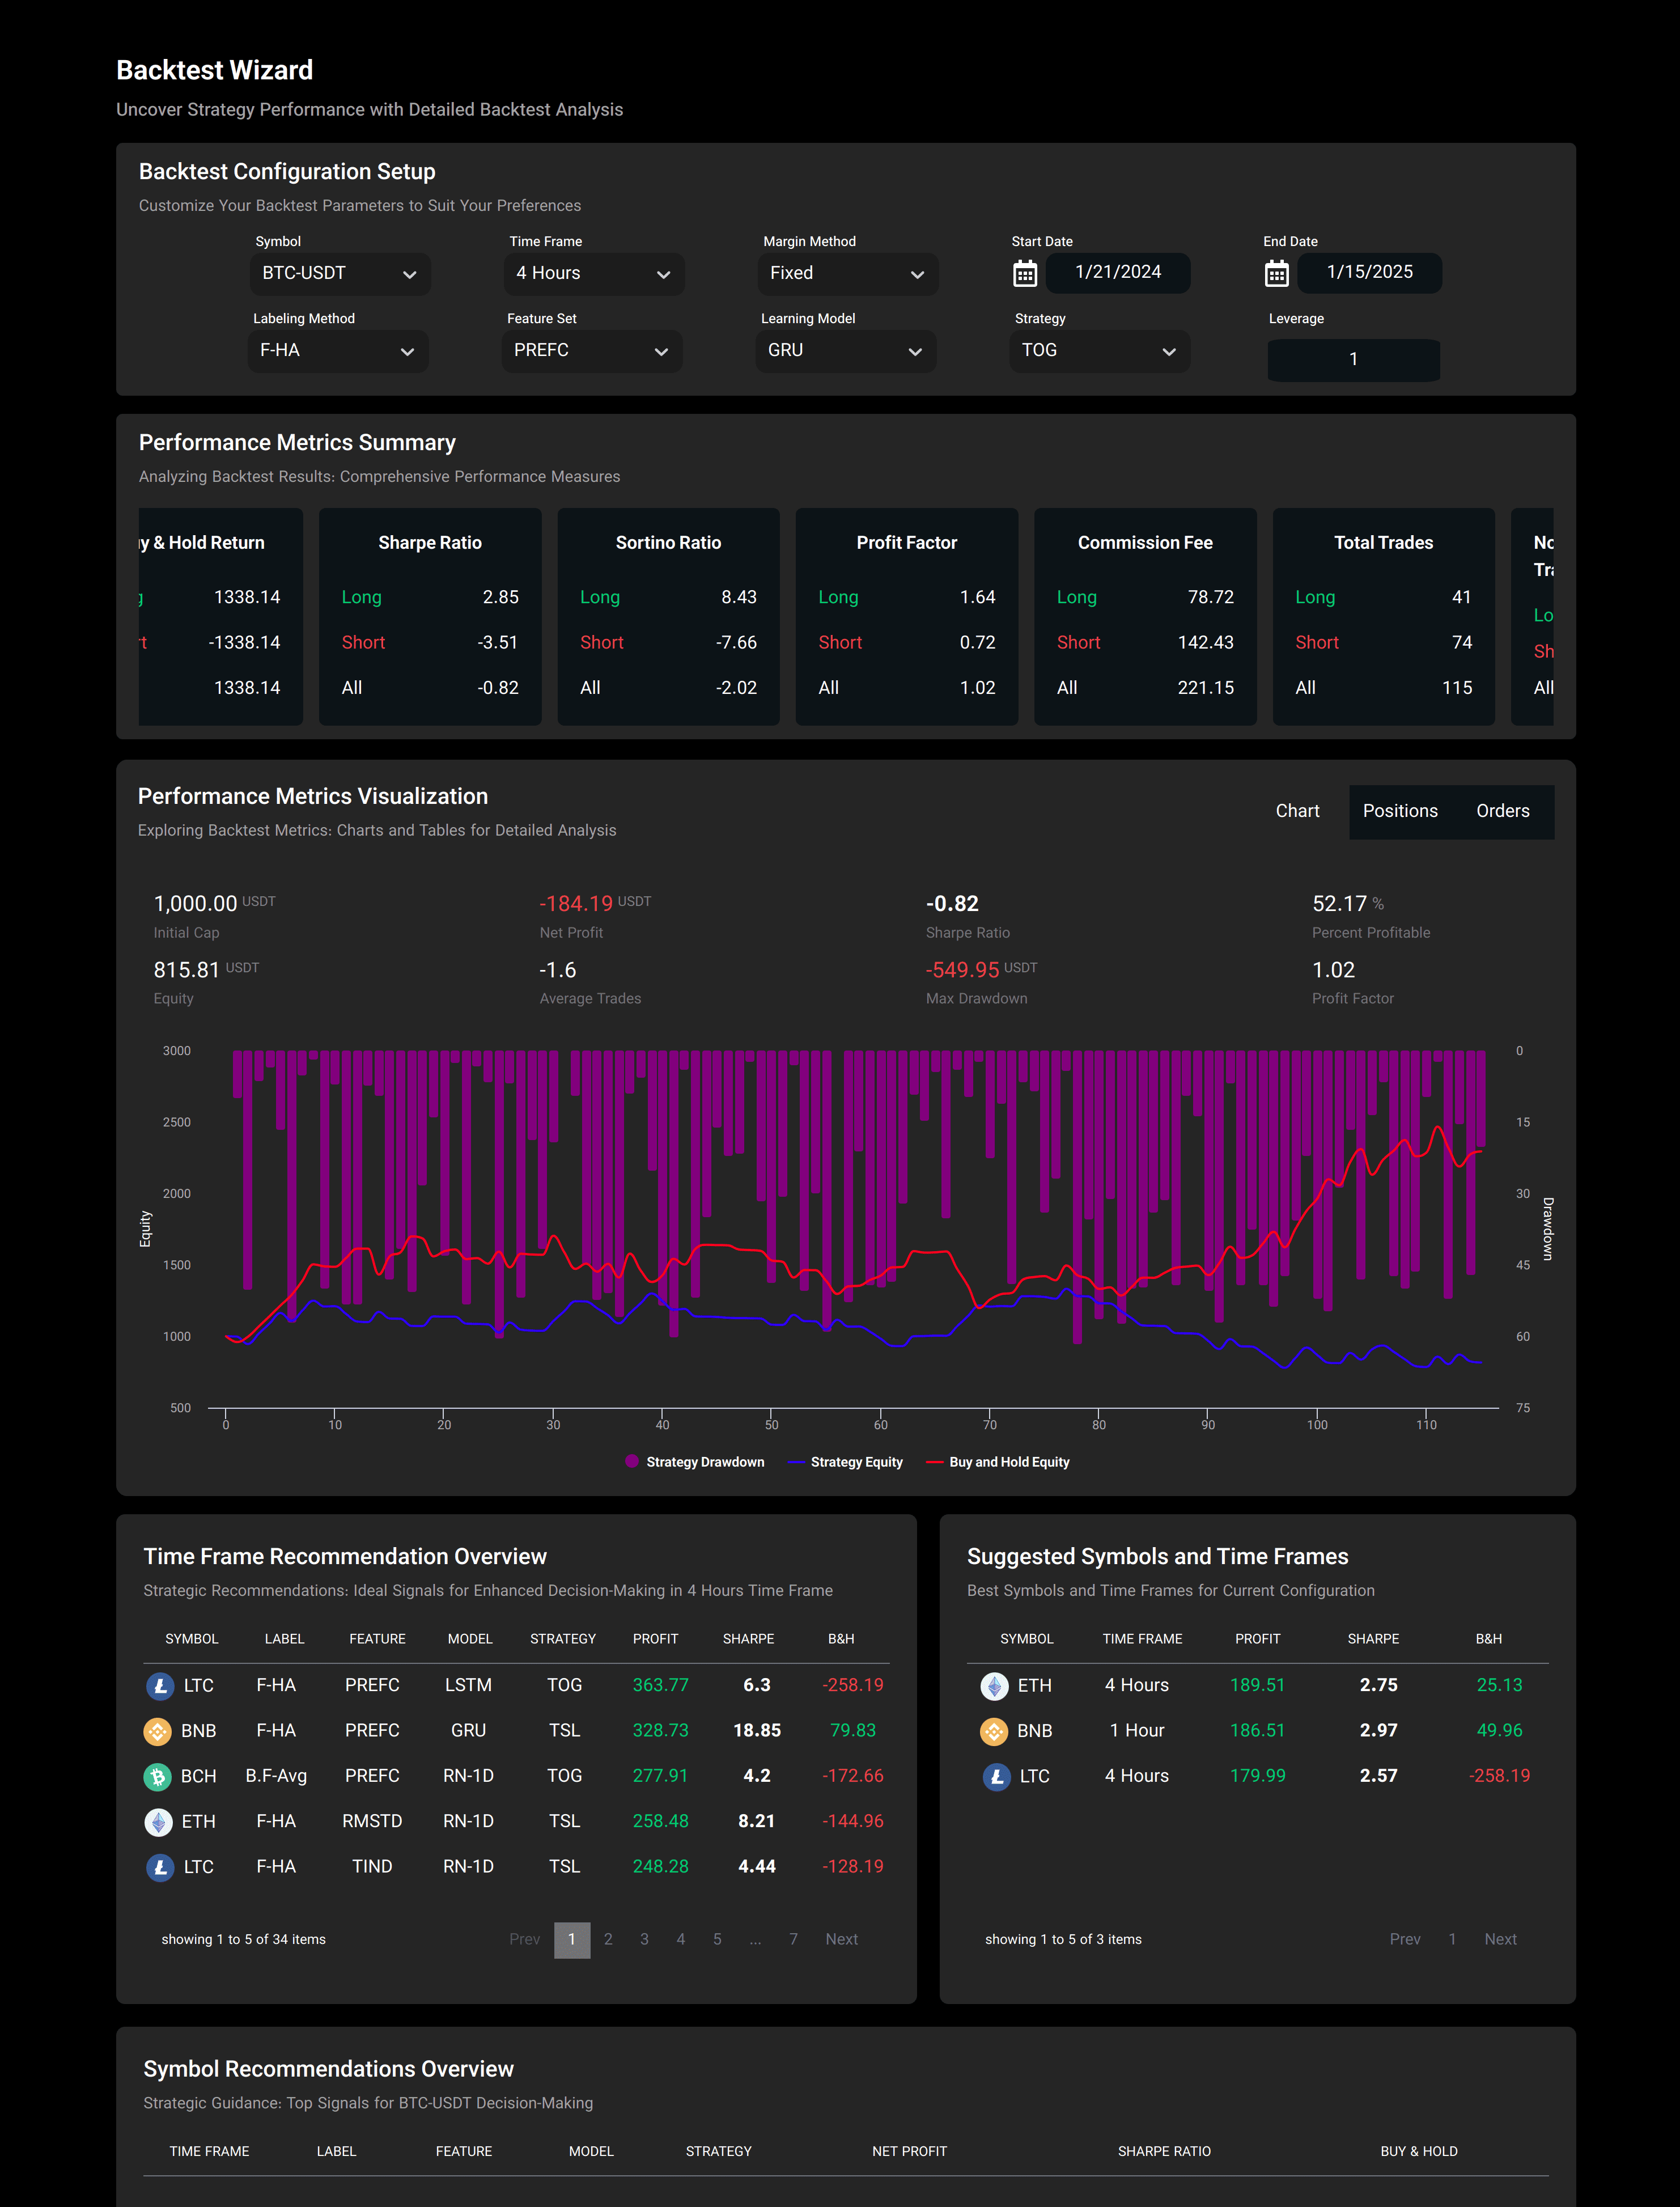
Translate predictions into executable entry and exit behavior, then review positions and performance.
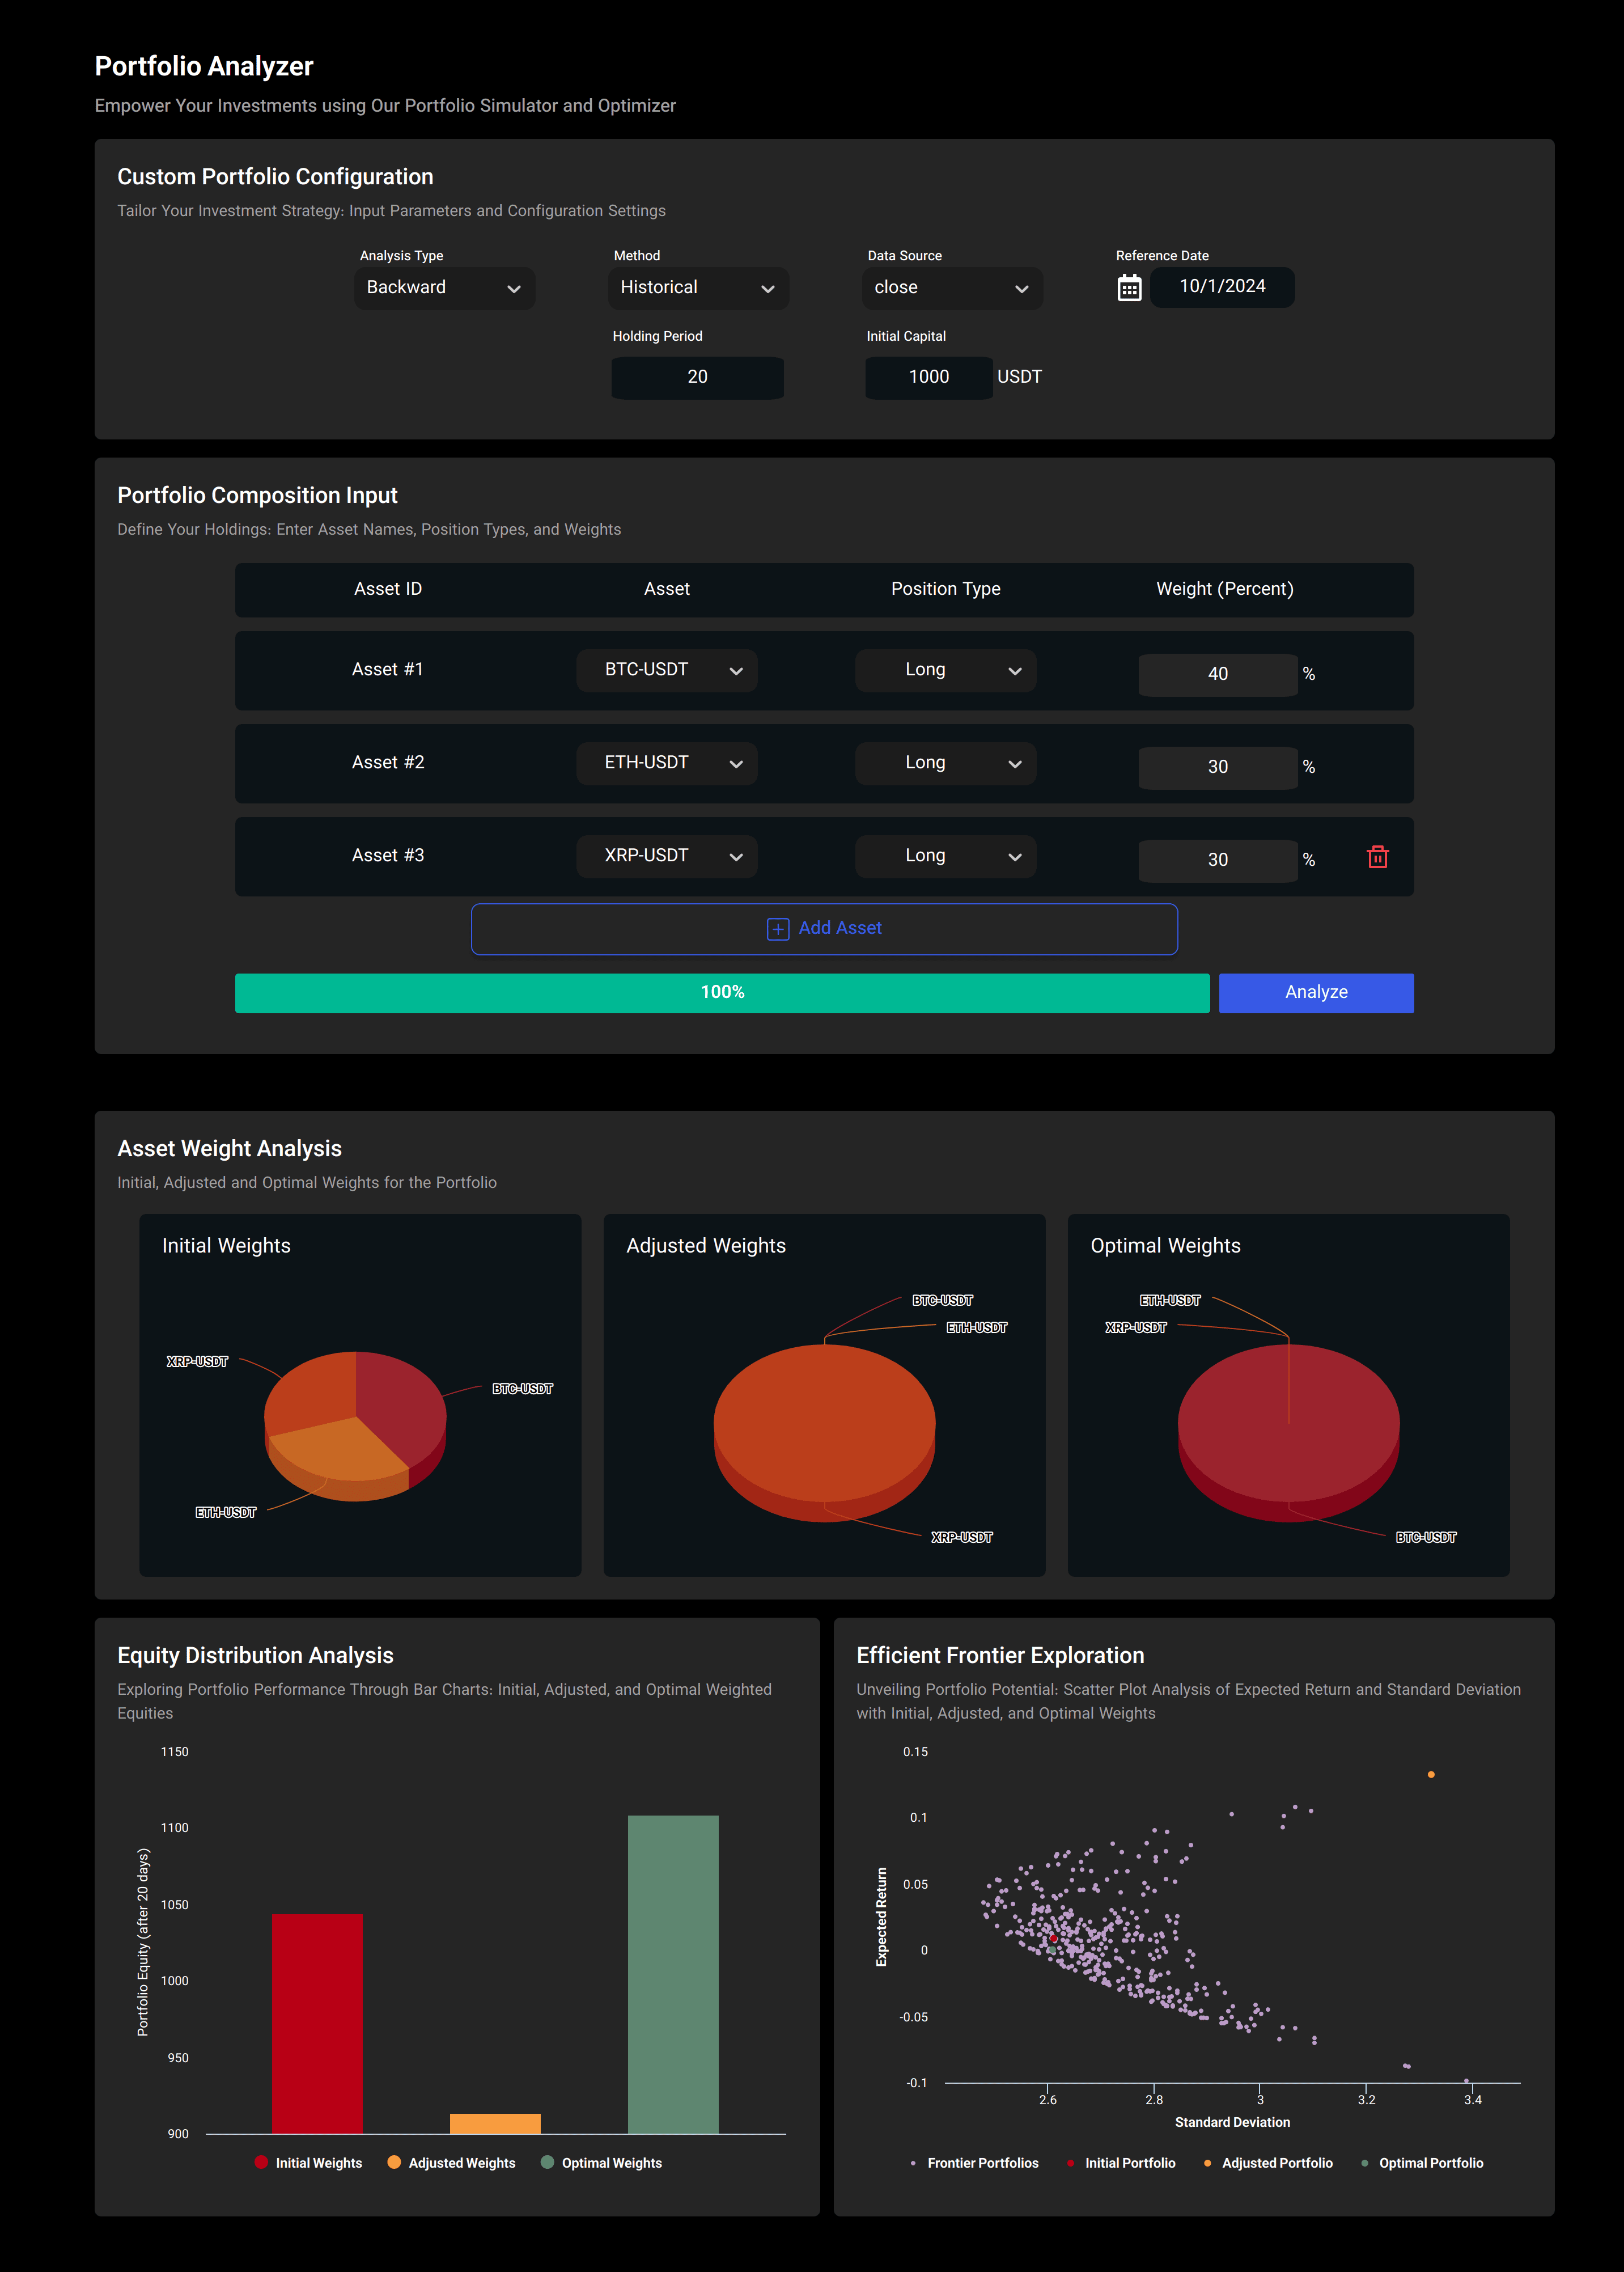
Evaluate allocation, risk, return, and scenario outcomes beyond one symbol or one model run.
The demo is built around functioning FinBright workflows, with seeded BTC and ETH model histories and broader market data for context.
Use a compact market overview to move from broad context into a specific asset, timeframe, and decision path.
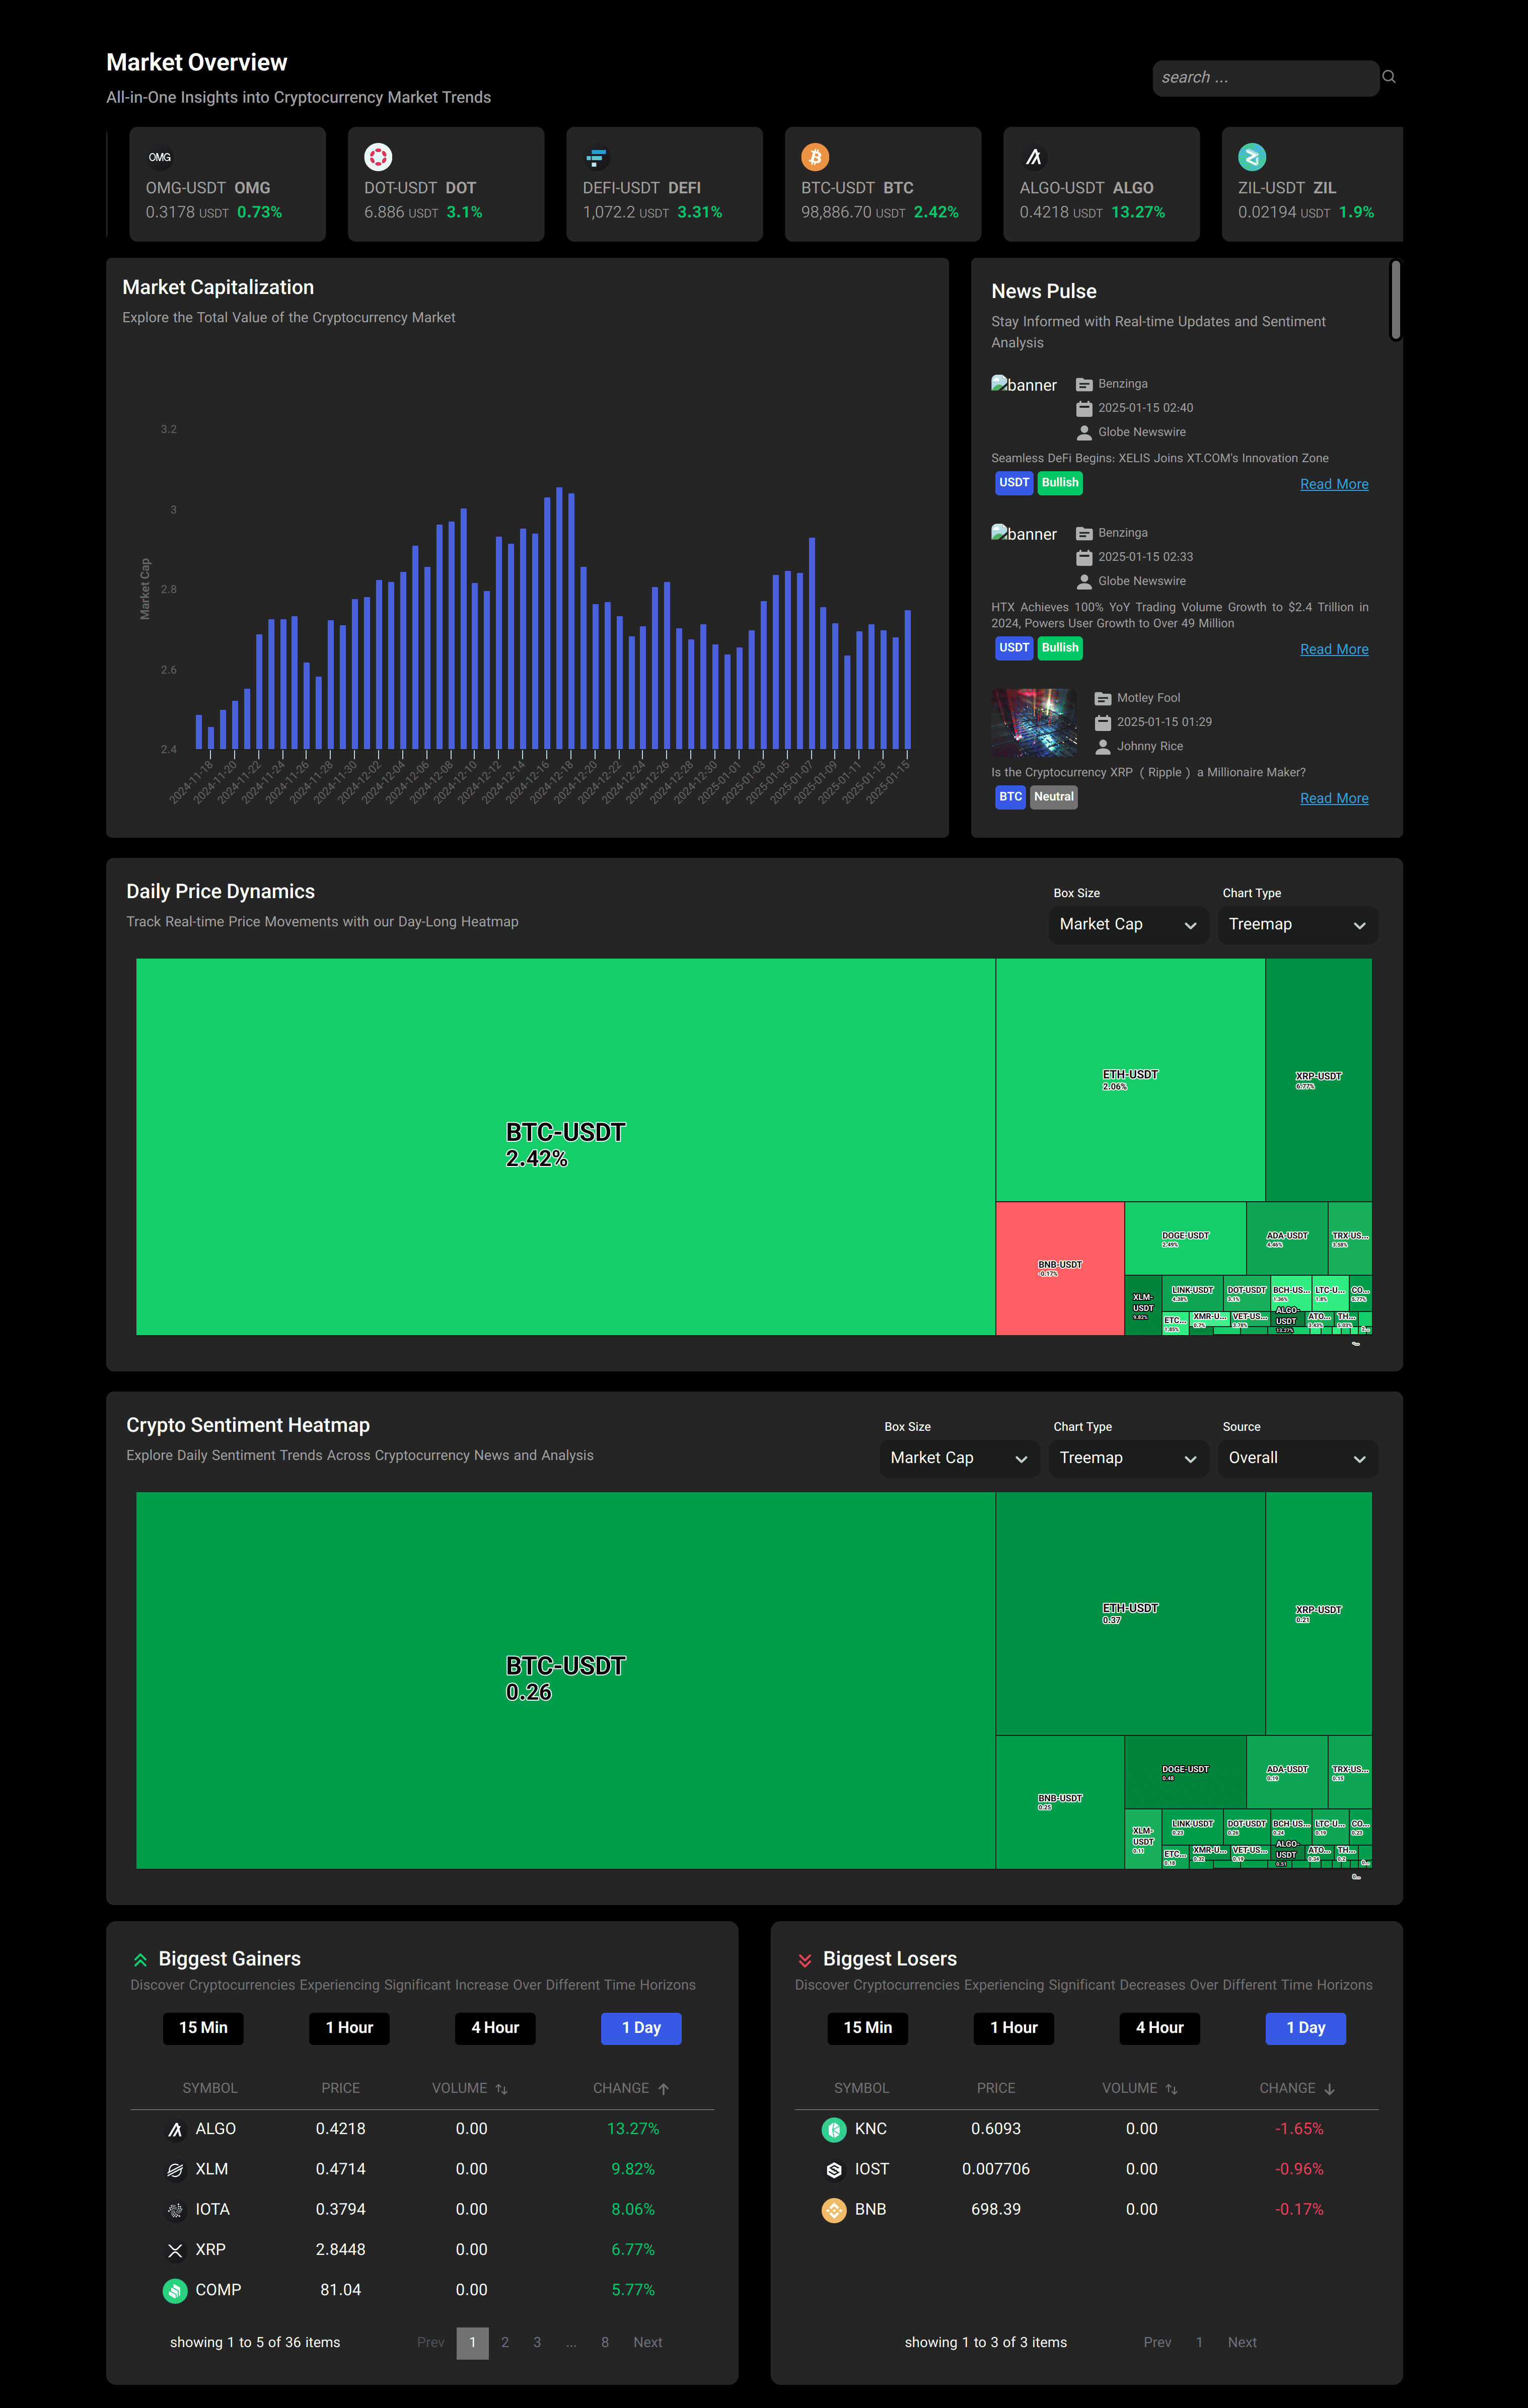
Prediction pages show model outputs beside historical context so model behavior can be reviewed instead of accepted blindly.
Strategy views connect model signals to orders, positions, and performance metrics, giving investors a clearer story than a raw accuracy score.
Portfolio analytics help move the conversation from a single winning trade to allocation, risk, and repeatability.
Walk through market context, prediction history, AL-TOG strategy results, and portfolio analytics in one session.